
TekMatix Help Articles

Afilliates / Appointment
How to Track Google Ads Performance in Tekmatix Dashboards
Managing Google Ads is powerful, but let’s be honest, jumping between platforms just to check your ad performance can be a pain.
Now, you can view your Google Ads results directly inside your Tekmatix dashboards.
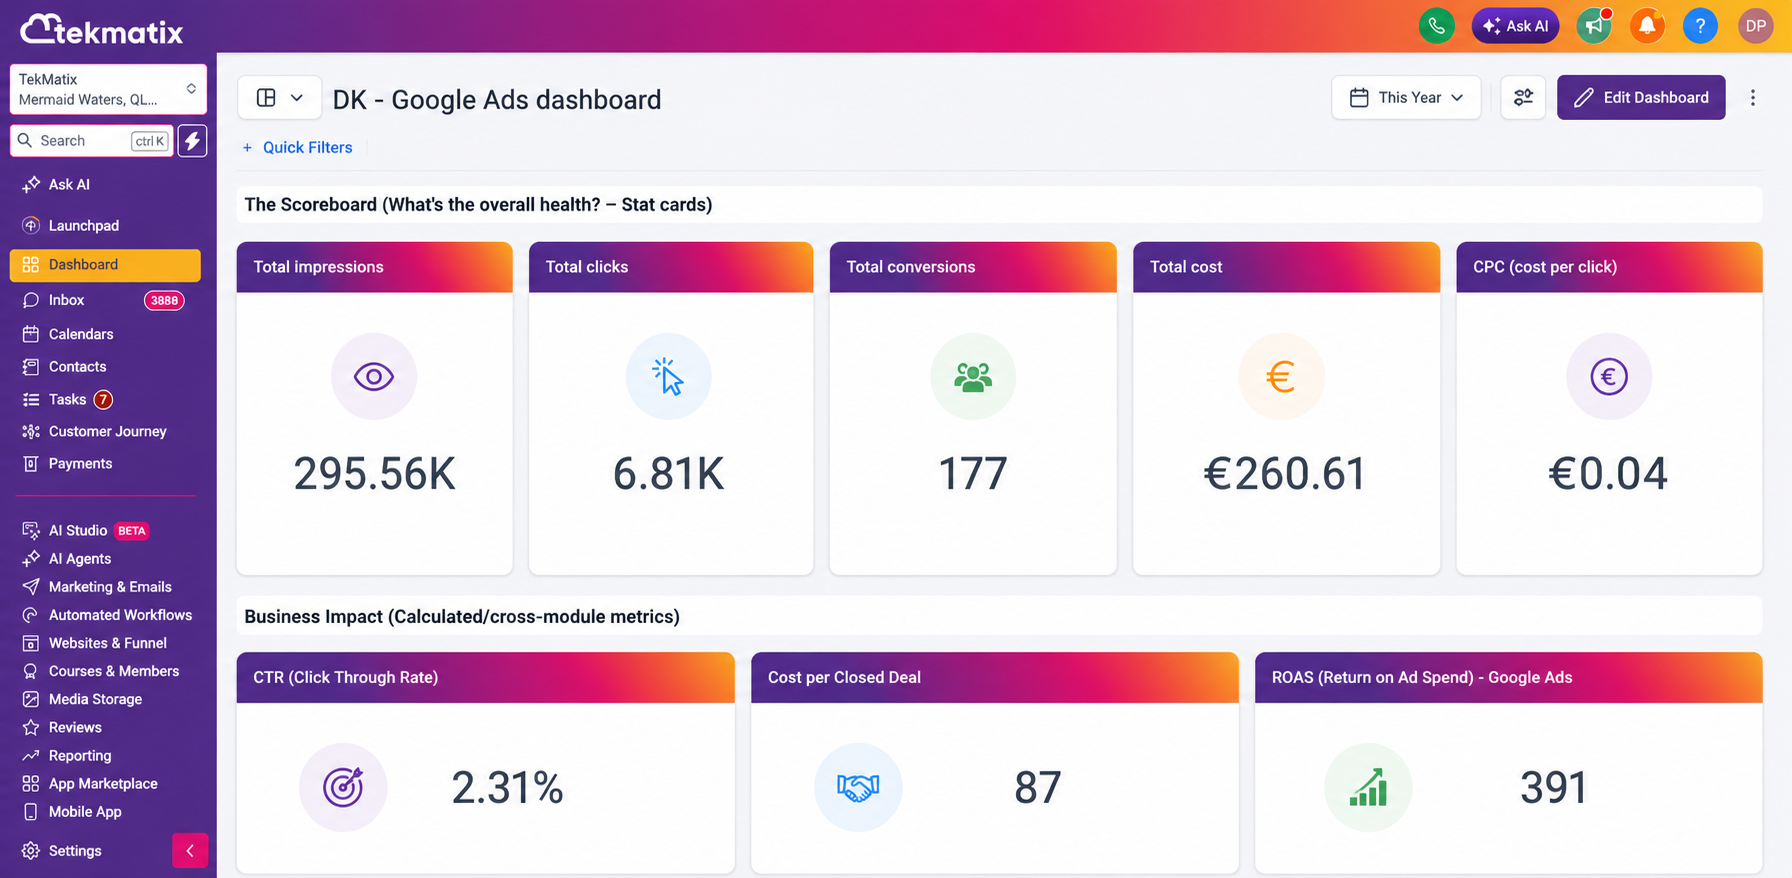
With the new Google Ads dashboard widgets, you can track your ad spend, clicks, impressions, conversions and campaign performance right where you already manage your business data.
No extra tabs. No separate reporting platform. No digging around trying to piece everything together.
Just clear, connected reporting inside Tekmatix.
What’s New?
A dedicated Google Ads section is now available inside the Tekmatix Dashboards widget panel.
Once your Google Ads account is connected at the sub-account level, your dashboard widgets will automatically pull in your Google Ads data.
You now have access to 11 ready-to-use Google Ads widgets, including:
Total conversions
Conversions over time
Total cost
Cost over time
Total clicks
Clicks over time
Total impressions
Impressions over time
Clicks by campaign
Conversions by campaign
CPC, also known as cost per click
Each widget is fully configurable, so you can filter your reporting by campaign, campaign type, zero impressions, zero conversions and PPC markup.
This means you can create the exact view you need, whether you’re checking your own ad performance or reporting results to clients.
Build Smarter Custom Metrics
Google Ads metrics are also now available as dimensions inside Custom Metrics.
This gives you the ability to build more meaningful cross-platform KPIs using the formula builder.
For example, you could create custom metrics such as:
Return on ad spend
Cost per closed deal
Cost per booked appointment
Cost per lead
Campaign spend compared with pipeline value
This is where your reporting becomes much more powerful.
Instead of only seeing how many clicks or conversions your ads generated, you can start connecting your advertising spend to real business outcomes.
How It Works
To add Google Ads widgets to your dashboard:
Open any dashboard inside Tekmatix.
Click Edit dashboard.
Click Add widget.
Scroll to the new Google Ads section.
Choose the widget you want to add.
Confirm your linked Google Ads account inside the Integration tab.
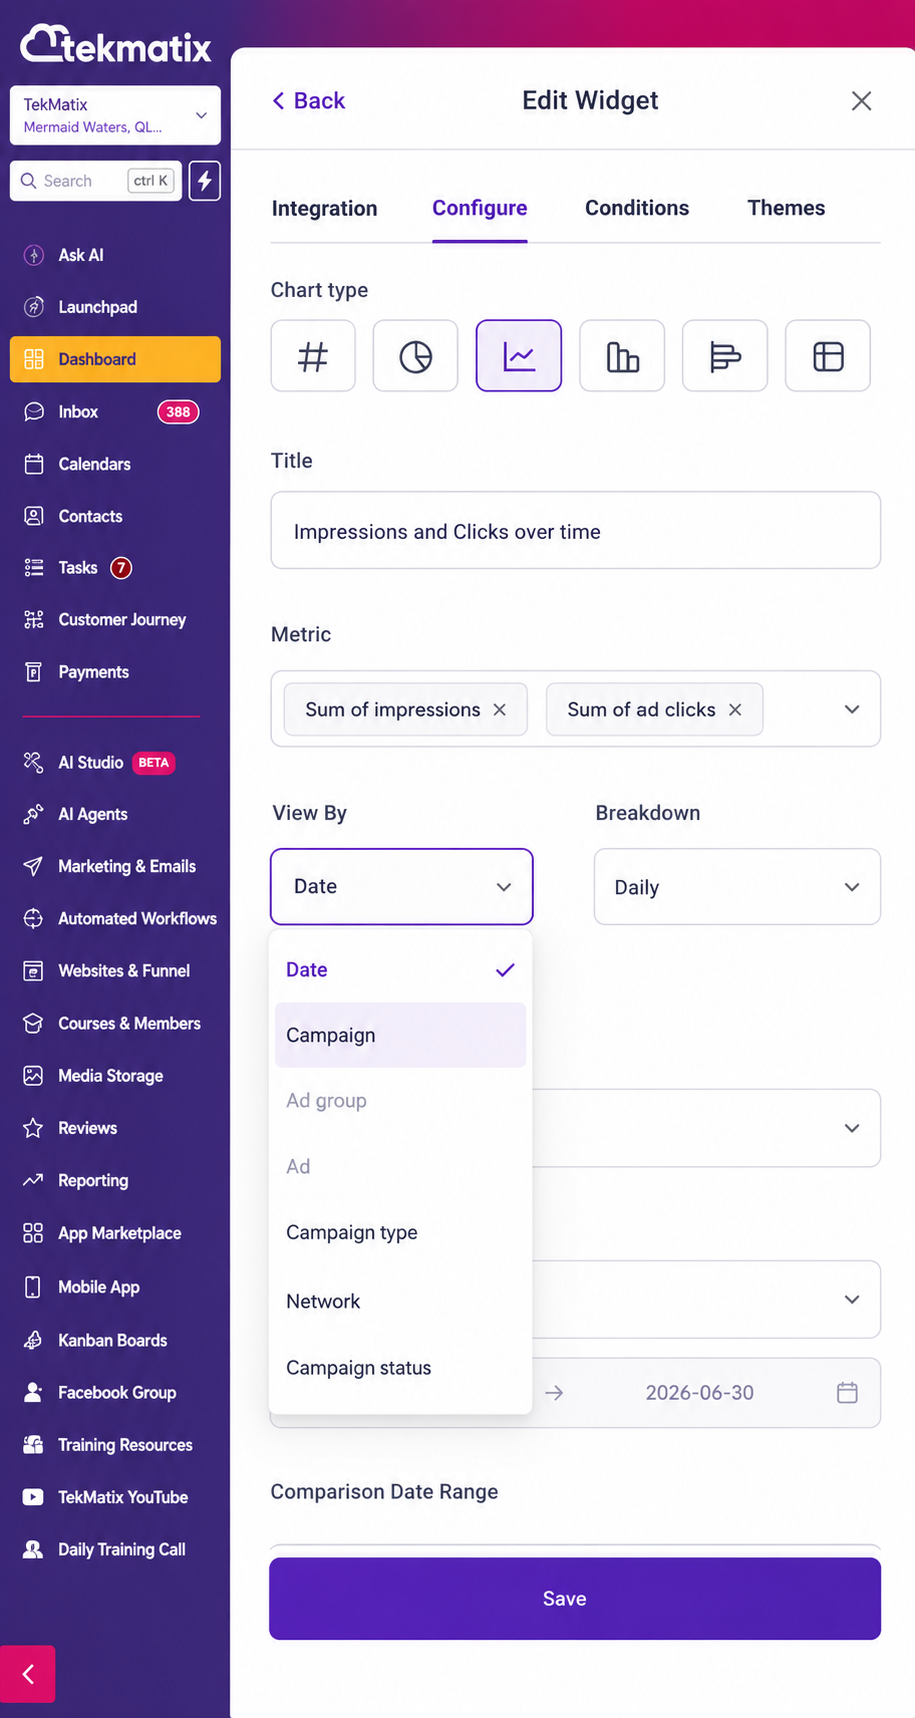
Configure your filters and chart type.
Click Save changes.
Once saved, your selected Google Ads widget will appear on your dashboard and display your reporting data automatically.
Why This Matters
See Everything in One Place
Your Google Ads performance can now sit alongside your other Tekmatix reporting widgets.
This means you can see your ad spend, clicks, impressions and conversions without logging into a separate advertising account every time you want an update.
For business owners, this saves time.
For agencies and service providers, this makes reporting much simpler.
Track Ad Spend at a Glance
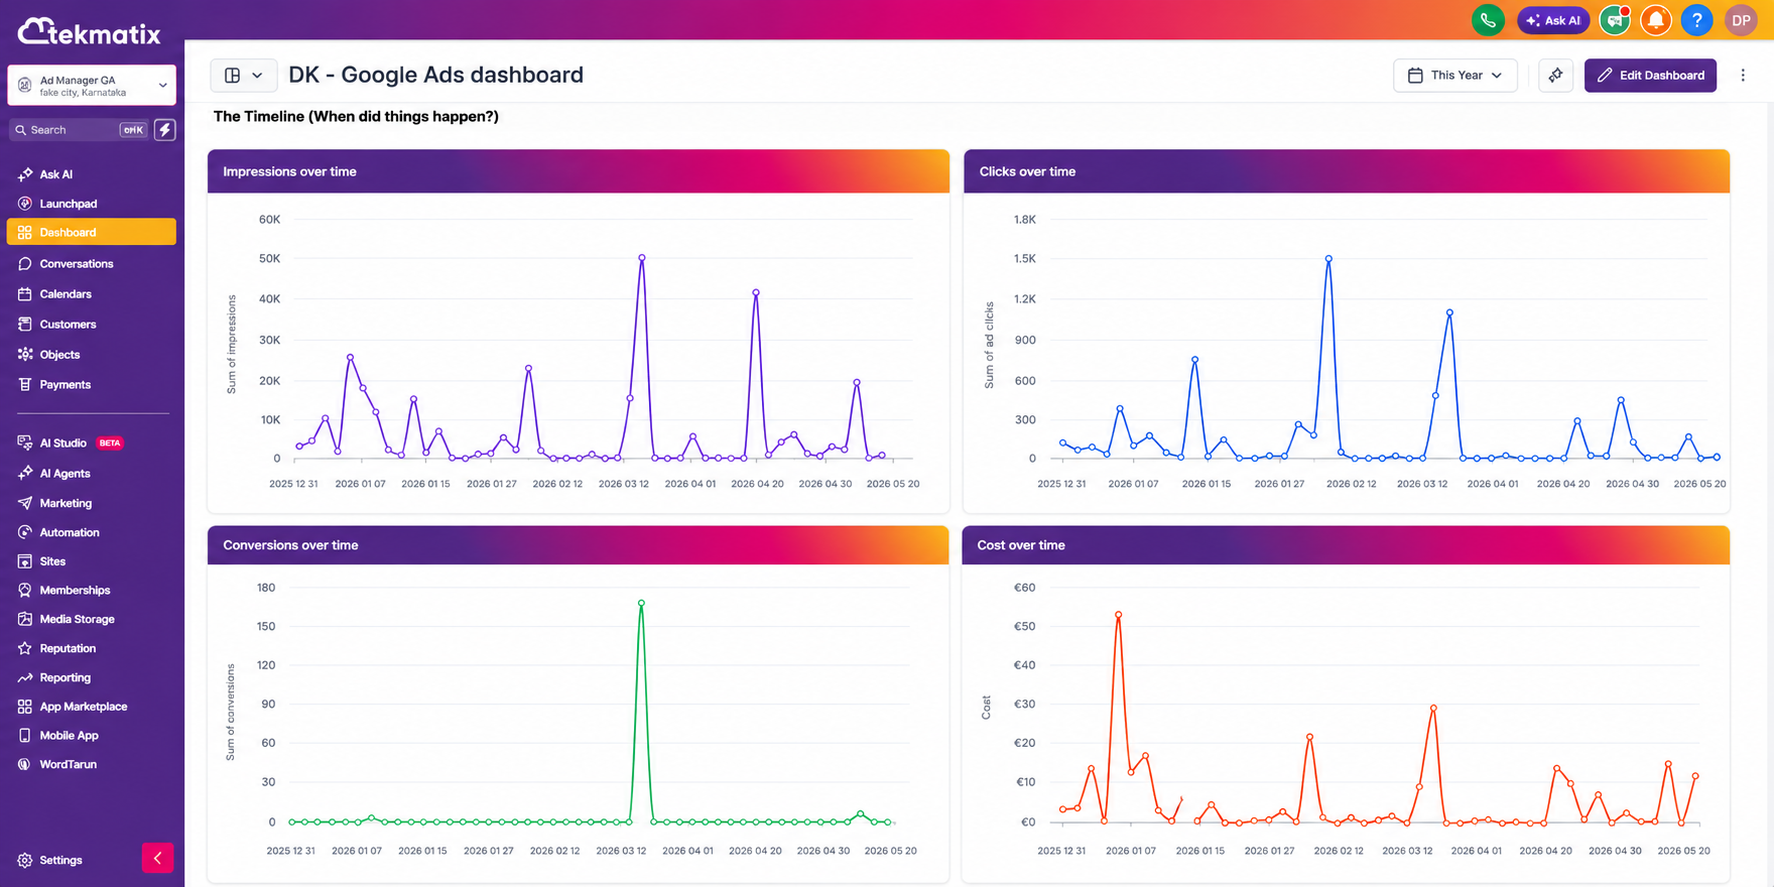
With the Total Cost and Cost Over Time widgets, you can quickly see how much is being spent and when.
This makes it easier to monitor ad budgets, catch unusual spending patterns and avoid those lovely end-of-month surprises that nobody asked for.
See Which Campaigns Are Actually Working
The Clicks by Campaign and Conversions by Campaign widgets let you break down performance at the campaign level.
This helps you quickly identify which campaigns are generating activity and which ones may need attention.
Because clicks are nice, but conversions are what usually matter most.
Connect Advertising to Real Business Results
This is the big one.
Because Google Ads data can now be used inside Custom Metrics, you can combine ad performance with your pipeline, sales and revenue data.
That means you can move beyond surface-level reporting and start answering much better questions, such as:
How much did we spend to generate this lead?
Which campaigns are turning into booked appointments?
What is our cost per sale?
Are our ads generating real return?
Which campaigns should we scale, pause or improve?
This helps turn your dashboard into a proper decision-making tool, not just a collection of pretty charts.
Important Notes
Google Ads must be connected at the sub-account level before the widgets can show data.
To connect your account, go to:
Settings → Integrations → Google Ads
All 11 widgets support filtering by:
Campaign
Campaign type
Zero impressions
Zero conversions
PPC markup
These Google Ads reporting features are available inside:
Dashboards
Reporting
Custom Metrics
They are available on all Tekmatix plans that include Dashboards and Reporting.
What’s Coming Next?
More cross-channel reporting is on the roadmap, including the ability to combine Google Ads data with other marketing sources.
This means you’ll be able to get an even clearer view of how your marketing is performing across multiple channels, all from inside Tekmatix.
Final Thoughts
Your ad data should not live in isolation.
When your advertising, leads, pipelines, sales and reporting are all connected, you can make much smarter decisions about where your money is going and what is actually producing results.
The new Google Ads dashboard widgets make it easier to see your performance, understand your spend and connect your campaigns to real business outcomes.
And that is exactly what good reporting should do.

Blogs / Calendars / Campaign
How to Track Google Ads Performance in Tekmatix Dashboards
Managing Google Ads is powerful, but let’s be honest, jumping between platforms just to check your ad performance can be a pain.
Now, you can view your Google Ads results directly inside your Tekmatix dashboards.
With the new Google Ads dashboard widgets, you can track your ad spend, clicks, impressions, conversions and campaign performance right where you already manage your business data.
No extra tabs. No separate reporting platform. No digging around trying to piece everything together.
Just clear, connected reporting inside Tekmatix.
What’s New?
A dedicated Google Ads section is now available inside the Tekmatix Dashboards widget panel.
Once your Google Ads account is connected at the sub-account level, your dashboard widgets will automatically pull in your Google Ads data.
You now have access to 11 ready-to-use Google Ads widgets, including:
Total conversions
Conversions over time
Total cost
Cost over time
Total clicks
Clicks over time
Total impressions
Impressions over time
Clicks by campaign
Conversions by campaign
CPC, also known as cost per click
Each widget is fully configurable, so you can filter your reporting by campaign, campaign type, zero impressions, zero conversions and PPC markup.
This means you can create the exact view you need, whether you’re checking your own ad performance or reporting results to clients.
Build Smarter Custom Metrics
Google Ads metrics are also now available as dimensions inside Custom Metrics.
This gives you the ability to build more meaningful cross-platform KPIs using the formula builder.
For example, you could create custom metrics such as:
Return on ad spend
Cost per closed deal
Cost per booked appointment
Cost per lead
Campaign spend compared with pipeline value
This is where your reporting becomes much more powerful.
Instead of only seeing how many clicks or conversions your ads generated, you can start connecting your advertising spend to real business outcomes.
How It Works
To add Google Ads widgets to your dashboard:
Open any dashboard inside Tekmatix.
Click Edit dashboard.
Click Add widget.
Scroll to the new Google Ads section.
Choose the widget you want to add.
Confirm your linked Google Ads account inside the Integration tab.
Configure your filters and chart type.
Click Save changes.
Once saved, your selected Google Ads widget will appear on your dashboard and display your reporting data automatically.
Why This Matters
See Everything in One Place
Your Google Ads performance can now sit alongside your other Tekmatix reporting widgets.
This means you can see your ad spend, clicks, impressions and conversions without logging into a separate advertising account every time you want an update.
For business owners, this saves time.
For agencies and service providers, this makes reporting much simpler.
Track Ad Spend at a Glance
With the Total Cost and Cost Over Time widgets, you can quickly see how much is being spent and when.
This makes it easier to monitor ad budgets, catch unusual spending patterns and avoid those lovely end-of-month surprises that nobody asked for.
See Which Campaigns Are Actually Working
The Clicks by Campaign and Conversions by Campaign widgets let you break down performance at the campaign level.
This helps you quickly identify which campaigns are generating activity and which ones may need attention.
Because clicks are nice, but conversions are what usually matter most.
Connect Advertising to Real Business Results
This is the big one.
Because Google Ads data can now be used inside Custom Metrics, you can combine ad performance with your pipeline, sales and revenue data.
That means you can move beyond surface-level reporting and start answering much better questions, such as:
How much did we spend to generate this lead?
Which campaigns are turning into booked appointments?
What is our cost per sale?
Are our ads generating real return?
Which campaigns should we scale, pause or improve?
This helps turn your dashboard into a proper decision-making tool, not just a collection of pretty charts.
Important Notes
Google Ads must be connected at the sub-account level before the widgets can show data.
To connect your account, go to:
Settings → Integrations → Google Ads
All 11 widgets support filtering by:
Campaign
Campaign type
Zero impressions
Zero conversions
PPC markup
These Google Ads reporting features are available inside:
Dashboards
Reporting
Custom Metrics
They are available on all Tekmatix plans that include Dashboards and Reporting.
What’s Coming Next?
More cross-channel reporting is on the roadmap, including the ability to combine Google Ads data with other marketing sources.
This means you’ll be able to get an even clearer view of how your marketing is performing across multiple channels, all from inside Tekmatix.
Final Thoughts
Your ad data should not live in isolation.
When your advertising, leads, pipelines, sales and reporting are all connected, you can make much smarter decisions about where your money is going and what is actually producing results.
The new Google Ads dashboard widgets make it easier to see your performance, understand your spend and connect your campaigns to real business outcomes.
And that is exactly what good reporting should do.
Course / CRM / Chat Widget
How to Track Google Ads Performance in Tekmatix Dashboards
Managing Google Ads is powerful, but let’s be honest, jumping between platforms just to check your ad performance can be a pain.
Now, you can view your Google Ads results directly inside your Tekmatix dashboards.
With the new Google Ads dashboard widgets, you can track your ad spend, clicks, impressions, conversions and campaign performance right where you already manage your business data.
No extra tabs. No separate reporting platform. No digging around trying to piece everything together.
Just clear, connected reporting inside Tekmatix.
What’s New?
A dedicated Google Ads section is now available inside the Tekmatix Dashboards widget panel.
Once your Google Ads account is connected at the sub-account level, your dashboard widgets will automatically pull in your Google Ads data.
You now have access to 11 ready-to-use Google Ads widgets, including:
Total conversions
Conversions over time
Total cost
Cost over time
Total clicks
Clicks over time
Total impressions
Impressions over time
Clicks by campaign
Conversions by campaign
CPC, also known as cost per click
Each widget is fully configurable, so you can filter your reporting by campaign, campaign type, zero impressions, zero conversions and PPC markup.
This means you can create the exact view you need, whether you’re checking your own ad performance or reporting results to clients.
Build Smarter Custom Metrics
Google Ads metrics are also now available as dimensions inside Custom Metrics.
This gives you the ability to build more meaningful cross-platform KPIs using the formula builder.
For example, you could create custom metrics such as:
Return on ad spend
Cost per closed deal
Cost per booked appointment
Cost per lead
Campaign spend compared with pipeline value
This is where your reporting becomes much more powerful.
Instead of only seeing how many clicks or conversions your ads generated, you can start connecting your advertising spend to real business outcomes.
How It Works
To add Google Ads widgets to your dashboard:
Open any dashboard inside Tekmatix.
Click Edit dashboard.
Click Add widget.
Scroll to the new Google Ads section.
Choose the widget you want to add.
Confirm your linked Google Ads account inside the Integration tab.
Configure your filters and chart type.
Click Save changes.
Once saved, your selected Google Ads widget will appear on your dashboard and display your reporting data automatically.
Why This Matters
See Everything in One Place
Your Google Ads performance can now sit alongside your other Tekmatix reporting widgets.
This means you can see your ad spend, clicks, impressions and conversions without logging into a separate advertising account every time you want an update.
For business owners, this saves time.
For agencies and service providers, this makes reporting much simpler.
Track Ad Spend at a Glance
With the Total Cost and Cost Over Time widgets, you can quickly see how much is being spent and when.
This makes it easier to monitor ad budgets, catch unusual spending patterns and avoid those lovely end-of-month surprises that nobody asked for.
See Which Campaigns Are Actually Working
The Clicks by Campaign and Conversions by Campaign widgets let you break down performance at the campaign level.
This helps you quickly identify which campaigns are generating activity and which ones may need attention.
Because clicks are nice, but conversions are what usually matter most.
Connect Advertising to Real Business Results
This is the big one.
Because Google Ads data can now be used inside Custom Metrics, you can combine ad performance with your pipeline, sales and revenue data.
That means you can move beyond surface-level reporting and start answering much better questions, such as:
How much did we spend to generate this lead?
Which campaigns are turning into booked appointments?
What is our cost per sale?
Are our ads generating real return?
Which campaigns should we scale, pause or improve?
This helps turn your dashboard into a proper decision-making tool, not just a collection of pretty charts.
Important Notes
Google Ads must be connected at the sub-account level before the widgets can show data.
To connect your account, go to:
Settings → Integrations → Google Ads
All 11 widgets support filtering by:
Campaign
Campaign type
Zero impressions
Zero conversions
PPC markup
These Google Ads reporting features are available inside:
Dashboards
Reporting
Custom Metrics
They are available on all Tekmatix plans that include Dashboards and Reporting.
What’s Coming Next?
More cross-channel reporting is on the roadmap, including the ability to combine Google Ads data with other marketing sources.
This means you’ll be able to get an even clearer view of how your marketing is performing across multiple channels, all from inside Tekmatix.
Final Thoughts
Your ad data should not live in isolation.
When your advertising, leads, pipelines, sales and reporting are all connected, you can make much smarter decisions about where your money is going and what is actually producing results.
The new Google Ads dashboard widgets make it easier to see your performance, understand your spend and connect your campaigns to real business outcomes.
And that is exactly what good reporting should do.
Compliance / Custom Fields
How to Track Google Ads Performance in Tekmatix Dashboards
Managing Google Ads is powerful, but let’s be honest, jumping between platforms just to check your ad performance can be a pain.
Now, you can view your Google Ads results directly inside your Tekmatix dashboards.
With the new Google Ads dashboard widgets, you can track your ad spend, clicks, impressions, conversions and campaign performance right where you already manage your business data.
No extra tabs. No separate reporting platform. No digging around trying to piece everything together.
Just clear, connected reporting inside Tekmatix.
What’s New?
A dedicated Google Ads section is now available inside the Tekmatix Dashboards widget panel.
Once your Google Ads account is connected at the sub-account level, your dashboard widgets will automatically pull in your Google Ads data.
You now have access to 11 ready-to-use Google Ads widgets, including:
Total conversions
Conversions over time
Total cost
Cost over time
Total clicks
Clicks over time
Total impressions
Impressions over time
Clicks by campaign
Conversions by campaign
CPC, also known as cost per click
Each widget is fully configurable, so you can filter your reporting by campaign, campaign type, zero impressions, zero conversions and PPC markup.
This means you can create the exact view you need, whether you’re checking your own ad performance or reporting results to clients.
Build Smarter Custom Metrics
Google Ads metrics are also now available as dimensions inside Custom Metrics.
This gives you the ability to build more meaningful cross-platform KPIs using the formula builder.
For example, you could create custom metrics such as:
Return on ad spend
Cost per closed deal
Cost per booked appointment
Cost per lead
Campaign spend compared with pipeline value
This is where your reporting becomes much more powerful.
Instead of only seeing how many clicks or conversions your ads generated, you can start connecting your advertising spend to real business outcomes.
How It Works
To add Google Ads widgets to your dashboard:
Open any dashboard inside Tekmatix.
Click Edit dashboard.
Click Add widget.
Scroll to the new Google Ads section.
Choose the widget you want to add.
Confirm your linked Google Ads account inside the Integration tab.
Configure your filters and chart type.
Click Save changes.
Once saved, your selected Google Ads widget will appear on your dashboard and display your reporting data automatically.
Why This Matters
See Everything in One Place
Your Google Ads performance can now sit alongside your other Tekmatix reporting widgets.
This means you can see your ad spend, clicks, impressions and conversions without logging into a separate advertising account every time you want an update.
For business owners, this saves time.
For agencies and service providers, this makes reporting much simpler.
Track Ad Spend at a Glance
With the Total Cost and Cost Over Time widgets, you can quickly see how much is being spent and when.
This makes it easier to monitor ad budgets, catch unusual spending patterns and avoid those lovely end-of-month surprises that nobody asked for.
See Which Campaigns Are Actually Working
The Clicks by Campaign and Conversions by Campaign widgets let you break down performance at the campaign level.
This helps you quickly identify which campaigns are generating activity and which ones may need attention.
Because clicks are nice, but conversions are what usually matter most.
Connect Advertising to Real Business Results
This is the big one.
Because Google Ads data can now be used inside Custom Metrics, you can combine ad performance with your pipeline, sales and revenue data.
That means you can move beyond surface-level reporting and start answering much better questions, such as:
How much did we spend to generate this lead?
Which campaigns are turning into booked appointments?
What is our cost per sale?
Are our ads generating real return?
Which campaigns should we scale, pause or improve?
This helps turn your dashboard into a proper decision-making tool, not just a collection of pretty charts.
Important Notes
Google Ads must be connected at the sub-account level before the widgets can show data.
To connect your account, go to:
Settings → Integrations → Google Ads
All 11 widgets support filtering by:
Campaign
Campaign type
Zero impressions
Zero conversions
PPC markup
These Google Ads reporting features are available inside:
Dashboards
Reporting
Custom Metrics
They are available on all Tekmatix plans that include Dashboards and Reporting.
What’s Coming Next?
More cross-channel reporting is on the roadmap, including the ability to combine Google Ads data with other marketing sources.
This means you’ll be able to get an even clearer view of how your marketing is performing across multiple channels, all from inside Tekmatix.
Final Thoughts
Your ad data should not live in isolation.
When your advertising, leads, pipelines, sales and reporting are all connected, you can make much smarter decisions about where your money is going and what is actually producing results.
The new Google Ads dashboard widgets make it easier to see your performance, understand your spend and connect your campaigns to real business outcomes.
And that is exactly what good reporting should do.
Dashboard / Domain
How to Track Google Ads Performance in Tekmatix Dashboards
Managing Google Ads is powerful, but let’s be honest, jumping between platforms just to check your ad performance can be a pain.
Now, you can view your Google Ads results directly inside your Tekmatix dashboards.
With the new Google Ads dashboard widgets, you can track your ad spend, clicks, impressions, conversions and campaign performance right where you already manage your business data.
No extra tabs. No separate reporting platform. No digging around trying to piece everything together.
Just clear, connected reporting inside Tekmatix.
What’s New?
A dedicated Google Ads section is now available inside the Tekmatix Dashboards widget panel.
Once your Google Ads account is connected at the sub-account level, your dashboard widgets will automatically pull in your Google Ads data.
You now have access to 11 ready-to-use Google Ads widgets, including:
Total conversions
Conversions over time
Total cost
Cost over time
Total clicks
Clicks over time
Total impressions
Impressions over time
Clicks by campaign
Conversions by campaign
CPC, also known as cost per click
Each widget is fully configurable, so you can filter your reporting by campaign, campaign type, zero impressions, zero conversions and PPC markup.
This means you can create the exact view you need, whether you’re checking your own ad performance or reporting results to clients.
Build Smarter Custom Metrics
Google Ads metrics are also now available as dimensions inside Custom Metrics.
This gives you the ability to build more meaningful cross-platform KPIs using the formula builder.
For example, you could create custom metrics such as:
Return on ad spend
Cost per closed deal
Cost per booked appointment
Cost per lead
Campaign spend compared with pipeline value
This is where your reporting becomes much more powerful.
Instead of only seeing how many clicks or conversions your ads generated, you can start connecting your advertising spend to real business outcomes.
How It Works
To add Google Ads widgets to your dashboard:
Open any dashboard inside Tekmatix.
Click Edit dashboard.
Click Add widget.
Scroll to the new Google Ads section.
Choose the widget you want to add.
Confirm your linked Google Ads account inside the Integration tab.
Configure your filters and chart type.
Click Save changes.
Once saved, your selected Google Ads widget will appear on your dashboard and display your reporting data automatically.
Why This Matters
See Everything in One Place
Your Google Ads performance can now sit alongside your other Tekmatix reporting widgets.
This means you can see your ad spend, clicks, impressions and conversions without logging into a separate advertising account every time you want an update.
For business owners, this saves time.
For agencies and service providers, this makes reporting much simpler.
Track Ad Spend at a Glance
With the Total Cost and Cost Over Time widgets, you can quickly see how much is being spent and when.
This makes it easier to monitor ad budgets, catch unusual spending patterns and avoid those lovely end-of-month surprises that nobody asked for.
See Which Campaigns Are Actually Working
The Clicks by Campaign and Conversions by Campaign widgets let you break down performance at the campaign level.
This helps you quickly identify which campaigns are generating activity and which ones may need attention.
Because clicks are nice, but conversions are what usually matter most.
Connect Advertising to Real Business Results
This is the big one.
Because Google Ads data can now be used inside Custom Metrics, you can combine ad performance with your pipeline, sales and revenue data.
That means you can move beyond surface-level reporting and start answering much better questions, such as:
How much did we spend to generate this lead?
Which campaigns are turning into booked appointments?
What is our cost per sale?
Are our ads generating real return?
Which campaigns should we scale, pause or improve?
This helps turn your dashboard into a proper decision-making tool, not just a collection of pretty charts.
Important Notes
Google Ads must be connected at the sub-account level before the widgets can show data.
To connect your account, go to:
Settings → Integrations → Google Ads
All 11 widgets support filtering by:
Campaign
Campaign type
Zero impressions
Zero conversions
PPC markup
These Google Ads reporting features are available inside:
Dashboards
Reporting
Custom Metrics
They are available on all Tekmatix plans that include Dashboards and Reporting.
What’s Coming Next?
More cross-channel reporting is on the roadmap, including the ability to combine Google Ads data with other marketing sources.
This means you’ll be able to get an even clearer view of how your marketing is performing across multiple channels, all from inside Tekmatix.
Final Thoughts
Your ad data should not live in isolation.
When your advertising, leads, pipelines, sales and reporting are all connected, you can make much smarter decisions about where your money is going and what is actually producing results.
The new Google Ads dashboard widgets make it easier to see your performance, understand your spend and connect your campaigns to real business outcomes.
And that is exactly what good reporting should do.
Email Builder / Email Deliverability
How to Track Google Ads Performance in Tekmatix Dashboards
Managing Google Ads is powerful, but let’s be honest, jumping between platforms just to check your ad performance can be a pain.
Now, you can view your Google Ads results directly inside your Tekmatix dashboards.
With the new Google Ads dashboard widgets, you can track your ad spend, clicks, impressions, conversions and campaign performance right where you already manage your business data.
No extra tabs. No separate reporting platform. No digging around trying to piece everything together.
Just clear, connected reporting inside Tekmatix.
What’s New?
A dedicated Google Ads section is now available inside the Tekmatix Dashboards widget panel.
Once your Google Ads account is connected at the sub-account level, your dashboard widgets will automatically pull in your Google Ads data.
You now have access to 11 ready-to-use Google Ads widgets, including:
Total conversions
Conversions over time
Total cost
Cost over time
Total clicks
Clicks over time
Total impressions
Impressions over time
Clicks by campaign
Conversions by campaign
CPC, also known as cost per click
Each widget is fully configurable, so you can filter your reporting by campaign, campaign type, zero impressions, zero conversions and PPC markup.
This means you can create the exact view you need, whether you’re checking your own ad performance or reporting results to clients.
Build Smarter Custom Metrics
Google Ads metrics are also now available as dimensions inside Custom Metrics.
This gives you the ability to build more meaningful cross-platform KPIs using the formula builder.
For example, you could create custom metrics such as:
Return on ad spend
Cost per closed deal
Cost per booked appointment
Cost per lead
Campaign spend compared with pipeline value
This is where your reporting becomes much more powerful.
Instead of only seeing how many clicks or conversions your ads generated, you can start connecting your advertising spend to real business outcomes.
How It Works
To add Google Ads widgets to your dashboard:
Open any dashboard inside Tekmatix.
Click Edit dashboard.
Click Add widget.
Scroll to the new Google Ads section.
Choose the widget you want to add.
Confirm your linked Google Ads account inside the Integration tab.
Configure your filters and chart type.
Click Save changes.
Once saved, your selected Google Ads widget will appear on your dashboard and display your reporting data automatically.
Why This Matters
See Everything in One Place
Your Google Ads performance can now sit alongside your other Tekmatix reporting widgets.
This means you can see your ad spend, clicks, impressions and conversions without logging into a separate advertising account every time you want an update.
For business owners, this saves time.
For agencies and service providers, this makes reporting much simpler.
Track Ad Spend at a Glance
With the Total Cost and Cost Over Time widgets, you can quickly see how much is being spent and when.
This makes it easier to monitor ad budgets, catch unusual spending patterns and avoid those lovely end-of-month surprises that nobody asked for.
See Which Campaigns Are Actually Working
The Clicks by Campaign and Conversions by Campaign widgets let you break down performance at the campaign level.
This helps you quickly identify which campaigns are generating activity and which ones may need attention.
Because clicks are nice, but conversions are what usually matter most.
Connect Advertising to Real Business Results
This is the big one.
Because Google Ads data can now be used inside Custom Metrics, you can combine ad performance with your pipeline, sales and revenue data.
That means you can move beyond surface-level reporting and start answering much better questions, such as:
How much did we spend to generate this lead?
Which campaigns are turning into booked appointments?
What is our cost per sale?
Are our ads generating real return?
Which campaigns should we scale, pause or improve?
This helps turn your dashboard into a proper decision-making tool, not just a collection of pretty charts.
Important Notes
Google Ads must be connected at the sub-account level before the widgets can show data.
To connect your account, go to:
Settings → Integrations → Google Ads
All 11 widgets support filtering by:
Campaign
Campaign type
Zero impressions
Zero conversions
PPC markup
These Google Ads reporting features are available inside:
Dashboards
Reporting
Custom Metrics
They are available on all Tekmatix plans that include Dashboards and Reporting.
What’s Coming Next?
More cross-channel reporting is on the roadmap, including the ability to combine Google Ads data with other marketing sources.
This means you’ll be able to get an even clearer view of how your marketing is performing across multiple channels, all from inside Tekmatix.
Final Thoughts
Your ad data should not live in isolation.
When your advertising, leads, pipelines, sales and reporting are all connected, you can make much smarter decisions about where your money is going and what is actually producing results.
The new Google Ads dashboard widgets make it easier to see your performance, understand your spend and connect your campaigns to real business outcomes.
And that is exactly what good reporting should do.
Form / Funnels
How to Track Google Ads Performance in Tekmatix Dashboards
Managing Google Ads is powerful, but let’s be honest, jumping between platforms just to check your ad performance can be a pain.
Now, you can view your Google Ads results directly inside your Tekmatix dashboards.
With the new Google Ads dashboard widgets, you can track your ad spend, clicks, impressions, conversions and campaign performance right where you already manage your business data.
No extra tabs. No separate reporting platform. No digging around trying to piece everything together.
Just clear, connected reporting inside Tekmatix.
What’s New?
A dedicated Google Ads section is now available inside the Tekmatix Dashboards widget panel.
Once your Google Ads account is connected at the sub-account level, your dashboard widgets will automatically pull in your Google Ads data.
You now have access to 11 ready-to-use Google Ads widgets, including:
Total conversions
Conversions over time
Total cost
Cost over time
Total clicks
Clicks over time
Total impressions
Impressions over time
Clicks by campaign
Conversions by campaign
CPC, also known as cost per click
Each widget is fully configurable, so you can filter your reporting by campaign, campaign type, zero impressions, zero conversions and PPC markup.
This means you can create the exact view you need, whether you’re checking your own ad performance or reporting results to clients.
Build Smarter Custom Metrics
Google Ads metrics are also now available as dimensions inside Custom Metrics.
This gives you the ability to build more meaningful cross-platform KPIs using the formula builder.
For example, you could create custom metrics such as:
Return on ad spend
Cost per closed deal
Cost per booked appointment
Cost per lead
Campaign spend compared with pipeline value
This is where your reporting becomes much more powerful.
Instead of only seeing how many clicks or conversions your ads generated, you can start connecting your advertising spend to real business outcomes.
How It Works
To add Google Ads widgets to your dashboard:
Open any dashboard inside Tekmatix.
Click Edit dashboard.
Click Add widget.
Scroll to the new Google Ads section.
Choose the widget you want to add.
Confirm your linked Google Ads account inside the Integration tab.
Configure your filters and chart type.
Click Save changes.
Once saved, your selected Google Ads widget will appear on your dashboard and display your reporting data automatically.
Why This Matters
See Everything in One Place
Your Google Ads performance can now sit alongside your other Tekmatix reporting widgets.
This means you can see your ad spend, clicks, impressions and conversions without logging into a separate advertising account every time you want an update.
For business owners, this saves time.
For agencies and service providers, this makes reporting much simpler.
Track Ad Spend at a Glance
With the Total Cost and Cost Over Time widgets, you can quickly see how much is being spent and when.
This makes it easier to monitor ad budgets, catch unusual spending patterns and avoid those lovely end-of-month surprises that nobody asked for.
See Which Campaigns Are Actually Working
The Clicks by Campaign and Conversions by Campaign widgets let you break down performance at the campaign level.
This helps you quickly identify which campaigns are generating activity and which ones may need attention.
Because clicks are nice, but conversions are what usually matter most.
Connect Advertising to Real Business Results
This is the big one.
Because Google Ads data can now be used inside Custom Metrics, you can combine ad performance with your pipeline, sales and revenue data.
That means you can move beyond surface-level reporting and start answering much better questions, such as:
How much did we spend to generate this lead?
Which campaigns are turning into booked appointments?
What is our cost per sale?
Are our ads generating real return?
Which campaigns should we scale, pause or improve?
This helps turn your dashboard into a proper decision-making tool, not just a collection of pretty charts.
Important Notes
Google Ads must be connected at the sub-account level before the widgets can show data.
To connect your account, go to:
Settings → Integrations → Google Ads
All 11 widgets support filtering by:
Campaign
Campaign type
Zero impressions
Zero conversions
PPC markup
These Google Ads reporting features are available inside:
Dashboards
Reporting
Custom Metrics
They are available on all Tekmatix plans that include Dashboards and Reporting.
What’s Coming Next?
More cross-channel reporting is on the roadmap, including the ability to combine Google Ads data with other marketing sources.
This means you’ll be able to get an even clearer view of how your marketing is performing across multiple channels, all from inside Tekmatix.
Final Thoughts
Your ad data should not live in isolation.
When your advertising, leads, pipelines, sales and reporting are all connected, you can make much smarter decisions about where your money is going and what is actually producing results.
The new Google Ads dashboard widgets make it easier to see your performance, understand your spend and connect your campaigns to real business outcomes.
And that is exactly what good reporting should do.
Google My Business / Integrations
How to Track Google Ads Performance in Tekmatix Dashboards
Managing Google Ads is powerful, but let’s be honest, jumping between platforms just to check your ad performance can be a pain.
Now, you can view your Google Ads results directly inside your Tekmatix dashboards.
With the new Google Ads dashboard widgets, you can track your ad spend, clicks, impressions, conversions and campaign performance right where you already manage your business data.
No extra tabs. No separate reporting platform. No digging around trying to piece everything together.
Just clear, connected reporting inside Tekmatix.
What’s New?
A dedicated Google Ads section is now available inside the Tekmatix Dashboards widget panel.
Once your Google Ads account is connected at the sub-account level, your dashboard widgets will automatically pull in your Google Ads data.
You now have access to 11 ready-to-use Google Ads widgets, including:
Total conversions
Conversions over time
Total cost
Cost over time
Total clicks
Clicks over time
Total impressions
Impressions over time
Clicks by campaign
Conversions by campaign
CPC, also known as cost per click
Each widget is fully configurable, so you can filter your reporting by campaign, campaign type, zero impressions, zero conversions and PPC markup.
This means you can create the exact view you need, whether you’re checking your own ad performance or reporting results to clients.
Build Smarter Custom Metrics
Google Ads metrics are also now available as dimensions inside Custom Metrics.
This gives you the ability to build more meaningful cross-platform KPIs using the formula builder.
For example, you could create custom metrics such as:
Return on ad spend
Cost per closed deal
Cost per booked appointment
Cost per lead
Campaign spend compared with pipeline value
This is where your reporting becomes much more powerful.
Instead of only seeing how many clicks or conversions your ads generated, you can start connecting your advertising spend to real business outcomes.
How It Works
To add Google Ads widgets to your dashboard:
Open any dashboard inside Tekmatix.
Click Edit dashboard.
Click Add widget.
Scroll to the new Google Ads section.
Choose the widget you want to add.
Confirm your linked Google Ads account inside the Integration tab.
Configure your filters and chart type.
Click Save changes.
Once saved, your selected Google Ads widget will appear on your dashboard and display your reporting data automatically.
Why This Matters
See Everything in One Place
Your Google Ads performance can now sit alongside your other Tekmatix reporting widgets.
This means you can see your ad spend, clicks, impressions and conversions without logging into a separate advertising account every time you want an update.
For business owners, this saves time.
For agencies and service providers, this makes reporting much simpler.
Track Ad Spend at a Glance
With the Total Cost and Cost Over Time widgets, you can quickly see how much is being spent and when.
This makes it easier to monitor ad budgets, catch unusual spending patterns and avoid those lovely end-of-month surprises that nobody asked for.
See Which Campaigns Are Actually Working
The Clicks by Campaign and Conversions by Campaign widgets let you break down performance at the campaign level.
This helps you quickly identify which campaigns are generating activity and which ones may need attention.
Because clicks are nice, but conversions are what usually matter most.
Connect Advertising to Real Business Results
This is the big one.
Because Google Ads data can now be used inside Custom Metrics, you can combine ad performance with your pipeline, sales and revenue data.
That means you can move beyond surface-level reporting and start answering much better questions, such as:
How much did we spend to generate this lead?
Which campaigns are turning into booked appointments?
What is our cost per sale?
Are our ads generating real return?
Which campaigns should we scale, pause or improve?
This helps turn your dashboard into a proper decision-making tool, not just a collection of pretty charts.
Important Notes
Google Ads must be connected at the sub-account level before the widgets can show data.
To connect your account, go to:
Settings → Integrations → Google Ads
All 11 widgets support filtering by:
Campaign
Campaign type
Zero impressions
Zero conversions
PPC markup
These Google Ads reporting features are available inside:
Dashboards
Reporting
Custom Metrics
They are available on all Tekmatix plans that include Dashboards and Reporting.
What’s Coming Next?
More cross-channel reporting is on the roadmap, including the ability to combine Google Ads data with other marketing sources.
This means you’ll be able to get an even clearer view of how your marketing is performing across multiple channels, all from inside Tekmatix.
Final Thoughts
Your ad data should not live in isolation.
When your advertising, leads, pipelines, sales and reporting are all connected, you can make much smarter decisions about where your money is going and what is actually producing results.
The new Google Ads dashboard widgets make it easier to see your performance, understand your spend and connect your campaigns to real business outcomes.
And that is exactly what good reporting should do.
Invoices / LC Email / LC Phone
How to Track Google Ads Performance in Tekmatix Dashboards
Managing Google Ads is powerful, but let’s be honest, jumping between platforms just to check your ad performance can be a pain.
Now, you can view your Google Ads results directly inside your Tekmatix dashboards.
With the new Google Ads dashboard widgets, you can track your ad spend, clicks, impressions, conversions and campaign performance right where you already manage your business data.
No extra tabs. No separate reporting platform. No digging around trying to piece everything together.
Just clear, connected reporting inside Tekmatix.
What’s New?
A dedicated Google Ads section is now available inside the Tekmatix Dashboards widget panel.
Once your Google Ads account is connected at the sub-account level, your dashboard widgets will automatically pull in your Google Ads data.
You now have access to 11 ready-to-use Google Ads widgets, including:
Total conversions
Conversions over time
Total cost
Cost over time
Total clicks
Clicks over time
Total impressions
Impressions over time
Clicks by campaign
Conversions by campaign
CPC, also known as cost per click
Each widget is fully configurable, so you can filter your reporting by campaign, campaign type, zero impressions, zero conversions and PPC markup.
This means you can create the exact view you need, whether you’re checking your own ad performance or reporting results to clients.
Build Smarter Custom Metrics
Google Ads metrics are also now available as dimensions inside Custom Metrics.
This gives you the ability to build more meaningful cross-platform KPIs using the formula builder.
For example, you could create custom metrics such as:
Return on ad spend
Cost per closed deal
Cost per booked appointment
Cost per lead
Campaign spend compared with pipeline value
This is where your reporting becomes much more powerful.
Instead of only seeing how many clicks or conversions your ads generated, you can start connecting your advertising spend to real business outcomes.
How It Works
To add Google Ads widgets to your dashboard:
Open any dashboard inside Tekmatix.
Click Edit dashboard.
Click Add widget.
Scroll to the new Google Ads section.
Choose the widget you want to add.
Confirm your linked Google Ads account inside the Integration tab.
Configure your filters and chart type.
Click Save changes.
Once saved, your selected Google Ads widget will appear on your dashboard and display your reporting data automatically.
Why This Matters
See Everything in One Place
Your Google Ads performance can now sit alongside your other Tekmatix reporting widgets.
This means you can see your ad spend, clicks, impressions and conversions without logging into a separate advertising account every time you want an update.
For business owners, this saves time.
For agencies and service providers, this makes reporting much simpler.
Track Ad Spend at a Glance
With the Total Cost and Cost Over Time widgets, you can quickly see how much is being spent and when.
This makes it easier to monitor ad budgets, catch unusual spending patterns and avoid those lovely end-of-month surprises that nobody asked for.
See Which Campaigns Are Actually Working
The Clicks by Campaign and Conversions by Campaign widgets let you break down performance at the campaign level.
This helps you quickly identify which campaigns are generating activity and which ones may need attention.
Because clicks are nice, but conversions are what usually matter most.
Connect Advertising to Real Business Results
This is the big one.
Because Google Ads data can now be used inside Custom Metrics, you can combine ad performance with your pipeline, sales and revenue data.
That means you can move beyond surface-level reporting and start answering much better questions, such as:
How much did we spend to generate this lead?
Which campaigns are turning into booked appointments?
What is our cost per sale?
Are our ads generating real return?
Which campaigns should we scale, pause or improve?
This helps turn your dashboard into a proper decision-making tool, not just a collection of pretty charts.
Important Notes
Google Ads must be connected at the sub-account level before the widgets can show data.
To connect your account, go to:
Settings → Integrations → Google Ads
All 11 widgets support filtering by:
Campaign
Campaign type
Zero impressions
Zero conversions
PPC markup
These Google Ads reporting features are available inside:
Dashboards
Reporting
Custom Metrics
They are available on all Tekmatix plans that include Dashboards and Reporting.
What’s Coming Next?
More cross-channel reporting is on the roadmap, including the ability to combine Google Ads data with other marketing sources.
This means you’ll be able to get an even clearer view of how your marketing is performing across multiple channels, all from inside Tekmatix.
Final Thoughts
Your ad data should not live in isolation.
When your advertising, leads, pipelines, sales and reporting are all connected, you can make much smarter decisions about where your money is going and what is actually producing results.
The new Google Ads dashboard widgets make it easier to see your performance, understand your spend and connect your campaigns to real business outcomes.
And that is exactly what good reporting should do.
Memberships Area
How to Track Google Ads Performance in Tekmatix Dashboards
Managing Google Ads is powerful, but let’s be honest, jumping between platforms just to check your ad performance can be a pain.
Now, you can view your Google Ads results directly inside your Tekmatix dashboards.
With the new Google Ads dashboard widgets, you can track your ad spend, clicks, impressions, conversions and campaign performance right where you already manage your business data.
No extra tabs. No separate reporting platform. No digging around trying to piece everything together.
Just clear, connected reporting inside Tekmatix.
What’s New?
A dedicated Google Ads section is now available inside the Tekmatix Dashboards widget panel.
Once your Google Ads account is connected at the sub-account level, your dashboard widgets will automatically pull in your Google Ads data.
You now have access to 11 ready-to-use Google Ads widgets, including:
Total conversions
Conversions over time
Total cost
Cost over time
Total clicks
Clicks over time
Total impressions
Impressions over time
Clicks by campaign
Conversions by campaign
CPC, also known as cost per click
Each widget is fully configurable, so you can filter your reporting by campaign, campaign type, zero impressions, zero conversions and PPC markup.
This means you can create the exact view you need, whether you’re checking your own ad performance or reporting results to clients.
Build Smarter Custom Metrics
Google Ads metrics are also now available as dimensions inside Custom Metrics.
This gives you the ability to build more meaningful cross-platform KPIs using the formula builder.
For example, you could create custom metrics such as:
Return on ad spend
Cost per closed deal
Cost per booked appointment
Cost per lead
Campaign spend compared with pipeline value
This is where your reporting becomes much more powerful.
Instead of only seeing how many clicks or conversions your ads generated, you can start connecting your advertising spend to real business outcomes.
How It Works
To add Google Ads widgets to your dashboard:
Open any dashboard inside Tekmatix.
Click Edit dashboard.
Click Add widget.
Scroll to the new Google Ads section.
Choose the widget you want to add.
Confirm your linked Google Ads account inside the Integration tab.
Configure your filters and chart type.
Click Save changes.
Once saved, your selected Google Ads widget will appear on your dashboard and display your reporting data automatically.
Why This Matters
See Everything in One Place
Your Google Ads performance can now sit alongside your other Tekmatix reporting widgets.
This means you can see your ad spend, clicks, impressions and conversions without logging into a separate advertising account every time you want an update.
For business owners, this saves time.
For agencies and service providers, this makes reporting much simpler.
Track Ad Spend at a Glance
With the Total Cost and Cost Over Time widgets, you can quickly see how much is being spent and when.
This makes it easier to monitor ad budgets, catch unusual spending patterns and avoid those lovely end-of-month surprises that nobody asked for.
See Which Campaigns Are Actually Working
The Clicks by Campaign and Conversions by Campaign widgets let you break down performance at the campaign level.
This helps you quickly identify which campaigns are generating activity and which ones may need attention.
Because clicks are nice, but conversions are what usually matter most.
Connect Advertising to Real Business Results
This is the big one.
Because Google Ads data can now be used inside Custom Metrics, you can combine ad performance with your pipeline, sales and revenue data.
That means you can move beyond surface-level reporting and start answering much better questions, such as:
How much did we spend to generate this lead?
Which campaigns are turning into booked appointments?
What is our cost per sale?
Are our ads generating real return?
Which campaigns should we scale, pause or improve?
This helps turn your dashboard into a proper decision-making tool, not just a collection of pretty charts.
Important Notes
Google Ads must be connected at the sub-account level before the widgets can show data.
To connect your account, go to:
Settings → Integrations → Google Ads
All 11 widgets support filtering by:
Campaign
Campaign type
Zero impressions
Zero conversions
PPC markup
These Google Ads reporting features are available inside:
Dashboards
Reporting
Custom Metrics
They are available on all Tekmatix plans that include Dashboards and Reporting.
What’s Coming Next?
More cross-channel reporting is on the roadmap, including the ability to combine Google Ads data with other marketing sources.
This means you’ll be able to get an even clearer view of how your marketing is performing across multiple channels, all from inside Tekmatix.
Final Thoughts
Your ad data should not live in isolation.
When your advertising, leads, pipelines, sales and reporting are all connected, you can make much smarter decisions about where your money is going and what is actually producing results.
The new Google Ads dashboard widgets make it easier to see your performance, understand your spend and connect your campaigns to real business outcomes.
And that is exactly what good reporting should do.
Opportunities & Pipeline / Payment
How to Track Google Ads Performance in Tekmatix Dashboards
Managing Google Ads is powerful, but let’s be honest, jumping between platforms just to check your ad performance can be a pain.
Now, you can view your Google Ads results directly inside your Tekmatix dashboards.
With the new Google Ads dashboard widgets, you can track your ad spend, clicks, impressions, conversions and campaign performance right where you already manage your business data.
No extra tabs. No separate reporting platform. No digging around trying to piece everything together.
Just clear, connected reporting inside Tekmatix.
What’s New?
A dedicated Google Ads section is now available inside the Tekmatix Dashboards widget panel.
Once your Google Ads account is connected at the sub-account level, your dashboard widgets will automatically pull in your Google Ads data.
You now have access to 11 ready-to-use Google Ads widgets, including:
Total conversions
Conversions over time
Total cost
Cost over time
Total clicks
Clicks over time
Total impressions
Impressions over time
Clicks by campaign
Conversions by campaign
CPC, also known as cost per click
Each widget is fully configurable, so you can filter your reporting by campaign, campaign type, zero impressions, zero conversions and PPC markup.
This means you can create the exact view you need, whether you’re checking your own ad performance or reporting results to clients.
Build Smarter Custom Metrics
Google Ads metrics are also now available as dimensions inside Custom Metrics.
This gives you the ability to build more meaningful cross-platform KPIs using the formula builder.
For example, you could create custom metrics such as:
Return on ad spend
Cost per closed deal
Cost per booked appointment
Cost per lead
Campaign spend compared with pipeline value
This is where your reporting becomes much more powerful.
Instead of only seeing how many clicks or conversions your ads generated, you can start connecting your advertising spend to real business outcomes.
How It Works
To add Google Ads widgets to your dashboard:
Open any dashboard inside Tekmatix.
Click Edit dashboard.
Click Add widget.
Scroll to the new Google Ads section.
Choose the widget you want to add.
Confirm your linked Google Ads account inside the Integration tab.
Configure your filters and chart type.
Click Save changes.
Once saved, your selected Google Ads widget will appear on your dashboard and display your reporting data automatically.
Why This Matters
See Everything in One Place
Your Google Ads performance can now sit alongside your other Tekmatix reporting widgets.
This means you can see your ad spend, clicks, impressions and conversions without logging into a separate advertising account every time you want an update.
For business owners, this saves time.
For agencies and service providers, this makes reporting much simpler.
Track Ad Spend at a Glance
With the Total Cost and Cost Over Time widgets, you can quickly see how much is being spent and when.
This makes it easier to monitor ad budgets, catch unusual spending patterns and avoid those lovely end-of-month surprises that nobody asked for.
See Which Campaigns Are Actually Working
The Clicks by Campaign and Conversions by Campaign widgets let you break down performance at the campaign level.
This helps you quickly identify which campaigns are generating activity and which ones may need attention.
Because clicks are nice, but conversions are what usually matter most.
Connect Advertising to Real Business Results
This is the big one.
Because Google Ads data can now be used inside Custom Metrics, you can combine ad performance with your pipeline, sales and revenue data.
That means you can move beyond surface-level reporting and start answering much better questions, such as:
How much did we spend to generate this lead?
Which campaigns are turning into booked appointments?
What is our cost per sale?
Are our ads generating real return?
Which campaigns should we scale, pause or improve?
This helps turn your dashboard into a proper decision-making tool, not just a collection of pretty charts.
Important Notes
Google Ads must be connected at the sub-account level before the widgets can show data.
To connect your account, go to:
Settings → Integrations → Google Ads
All 11 widgets support filtering by:
Campaign
Campaign type
Zero impressions
Zero conversions
PPC markup
These Google Ads reporting features are available inside:
Dashboards
Reporting
Custom Metrics
They are available on all Tekmatix plans that include Dashboards and Reporting.
What’s Coming Next?
More cross-channel reporting is on the roadmap, including the ability to combine Google Ads data with other marketing sources.
This means you’ll be able to get an even clearer view of how your marketing is performing across multiple channels, all from inside Tekmatix.
Final Thoughts
Your ad data should not live in isolation.
When your advertising, leads, pipelines, sales and reporting are all connected, you can make much smarter decisions about where your money is going and what is actually producing results.
The new Google Ads dashboard widgets make it easier to see your performance, understand your spend and connect your campaigns to real business outcomes.
And that is exactly what good reporting should do.
Reputation Management / Review Request
How to Track Google Ads Performance in Tekmatix Dashboards
Managing Google Ads is powerful, but let’s be honest, jumping between platforms just to check your ad performance can be a pain.
Now, you can view your Google Ads results directly inside your Tekmatix dashboards.
With the new Google Ads dashboard widgets, you can track your ad spend, clicks, impressions, conversions and campaign performance right where you already manage your business data.
No extra tabs. No separate reporting platform. No digging around trying to piece everything together.
Just clear, connected reporting inside Tekmatix.
What’s New?
A dedicated Google Ads section is now available inside the Tekmatix Dashboards widget panel.
Once your Google Ads account is connected at the sub-account level, your dashboard widgets will automatically pull in your Google Ads data.
You now have access to 11 ready-to-use Google Ads widgets, including:
Total conversions
Conversions over time
Total cost
Cost over time
Total clicks
Clicks over time
Total impressions
Impressions over time
Clicks by campaign
Conversions by campaign
CPC, also known as cost per click
Each widget is fully configurable, so you can filter your reporting by campaign, campaign type, zero impressions, zero conversions and PPC markup.
This means you can create the exact view you need, whether you’re checking your own ad performance or reporting results to clients.
Build Smarter Custom Metrics
Google Ads metrics are also now available as dimensions inside Custom Metrics.
This gives you the ability to build more meaningful cross-platform KPIs using the formula builder.
For example, you could create custom metrics such as:
Return on ad spend
Cost per closed deal
Cost per booked appointment
Cost per lead
Campaign spend compared with pipeline value
This is where your reporting becomes much more powerful.
Instead of only seeing how many clicks or conversions your ads generated, you can start connecting your advertising spend to real business outcomes.
How It Works
To add Google Ads widgets to your dashboard:
Open any dashboard inside Tekmatix.
Click Edit dashboard.
Click Add widget.
Scroll to the new Google Ads section.
Choose the widget you want to add.
Confirm your linked Google Ads account inside the Integration tab.
Configure your filters and chart type.
Click Save changes.
Once saved, your selected Google Ads widget will appear on your dashboard and display your reporting data automatically.
Why This Matters
See Everything in One Place
Your Google Ads performance can now sit alongside your other Tekmatix reporting widgets.
This means you can see your ad spend, clicks, impressions and conversions without logging into a separate advertising account every time you want an update.
For business owners, this saves time.
For agencies and service providers, this makes reporting much simpler.
Track Ad Spend at a Glance
With the Total Cost and Cost Over Time widgets, you can quickly see how much is being spent and when.
This makes it easier to monitor ad budgets, catch unusual spending patterns and avoid those lovely end-of-month surprises that nobody asked for.
See Which Campaigns Are Actually Working
The Clicks by Campaign and Conversions by Campaign widgets let you break down performance at the campaign level.
This helps you quickly identify which campaigns are generating activity and which ones may need attention.
Because clicks are nice, but conversions are what usually matter most.
Connect Advertising to Real Business Results
This is the big one.
Because Google Ads data can now be used inside Custom Metrics, you can combine ad performance with your pipeline, sales and revenue data.
That means you can move beyond surface-level reporting and start answering much better questions, such as:
How much did we spend to generate this lead?
Which campaigns are turning into booked appointments?
What is our cost per sale?
Are our ads generating real return?
Which campaigns should we scale, pause or improve?
This helps turn your dashboard into a proper decision-making tool, not just a collection of pretty charts.
Important Notes
Google Ads must be connected at the sub-account level before the widgets can show data.
To connect your account, go to:
Settings → Integrations → Google Ads
All 11 widgets support filtering by:
Campaign
Campaign type
Zero impressions
Zero conversions
PPC markup
These Google Ads reporting features are available inside:
Dashboards
Reporting
Custom Metrics
They are available on all Tekmatix plans that include Dashboards and Reporting.
What’s Coming Next?
More cross-channel reporting is on the roadmap, including the ability to combine Google Ads data with other marketing sources.
This means you’ll be able to get an even clearer view of how your marketing is performing across multiple channels, all from inside Tekmatix.
Final Thoughts
Your ad data should not live in isolation.
When your advertising, leads, pipelines, sales and reporting are all connected, you can make much smarter decisions about where your money is going and what is actually producing results.
The new Google Ads dashboard widgets make it easier to see your performance, understand your spend and connect your campaigns to real business outcomes.
And that is exactly what good reporting should do.
Settings / SMS / SMTP Providers
How to Track Google Ads Performance in Tekmatix Dashboards
Managing Google Ads is powerful, but let’s be honest, jumping between platforms just to check your ad performance can be a pain.
Now, you can view your Google Ads results directly inside your Tekmatix dashboards.
With the new Google Ads dashboard widgets, you can track your ad spend, clicks, impressions, conversions and campaign performance right where you already manage your business data.
No extra tabs. No separate reporting platform. No digging around trying to piece everything together.
Just clear, connected reporting inside Tekmatix.
What’s New?
A dedicated Google Ads section is now available inside the Tekmatix Dashboards widget panel.
Once your Google Ads account is connected at the sub-account level, your dashboard widgets will automatically pull in your Google Ads data.
You now have access to 11 ready-to-use Google Ads widgets, including:
Total conversions
Conversions over time
Total cost
Cost over time
Total clicks
Clicks over time
Total impressions
Impressions over time
Clicks by campaign
Conversions by campaign
CPC, also known as cost per click
Each widget is fully configurable, so you can filter your reporting by campaign, campaign type, zero impressions, zero conversions and PPC markup.
This means you can create the exact view you need, whether you’re checking your own ad performance or reporting results to clients.
Build Smarter Custom Metrics
Google Ads metrics are also now available as dimensions inside Custom Metrics.
This gives you the ability to build more meaningful cross-platform KPIs using the formula builder.
For example, you could create custom metrics such as:
Return on ad spend
Cost per closed deal
Cost per booked appointment
Cost per lead
Campaign spend compared with pipeline value
This is where your reporting becomes much more powerful.
Instead of only seeing how many clicks or conversions your ads generated, you can start connecting your advertising spend to real business outcomes.
How It Works
To add Google Ads widgets to your dashboard:
Open any dashboard inside Tekmatix.
Click Edit dashboard.
Click Add widget.
Scroll to the new Google Ads section.
Choose the widget you want to add.
Confirm your linked Google Ads account inside the Integration tab.
Configure your filters and chart type.
Click Save changes.
Once saved, your selected Google Ads widget will appear on your dashboard and display your reporting data automatically.
Why This Matters
See Everything in One Place
Your Google Ads performance can now sit alongside your other Tekmatix reporting widgets.
This means you can see your ad spend, clicks, impressions and conversions without logging into a separate advertising account every time you want an update.
For business owners, this saves time.
For agencies and service providers, this makes reporting much simpler.
Track Ad Spend at a Glance
With the Total Cost and Cost Over Time widgets, you can quickly see how much is being spent and when.
This makes it easier to monitor ad budgets, catch unusual spending patterns and avoid those lovely end-of-month surprises that nobody asked for.
See Which Campaigns Are Actually Working
The Clicks by Campaign and Conversions by Campaign widgets let you break down performance at the campaign level.
This helps you quickly identify which campaigns are generating activity and which ones may need attention.
Because clicks are nice, but conversions are what usually matter most.
Connect Advertising to Real Business Results
This is the big one.
Because Google Ads data can now be used inside Custom Metrics, you can combine ad performance with your pipeline, sales and revenue data.
That means you can move beyond surface-level reporting and start answering much better questions, such as:
How much did we spend to generate this lead?
Which campaigns are turning into booked appointments?
What is our cost per sale?
Are our ads generating real return?
Which campaigns should we scale, pause or improve?
This helps turn your dashboard into a proper decision-making tool, not just a collection of pretty charts.
Important Notes
Google Ads must be connected at the sub-account level before the widgets can show data.
To connect your account, go to:
Settings → Integrations → Google Ads
All 11 widgets support filtering by:
Campaign
Campaign type
Zero impressions
Zero conversions
PPC markup
These Google Ads reporting features are available inside:
Dashboards
Reporting
Custom Metrics
They are available on all Tekmatix plans that include Dashboards and Reporting.
What’s Coming Next?
More cross-channel reporting is on the roadmap, including the ability to combine Google Ads data with other marketing sources.
This means you’ll be able to get an even clearer view of how your marketing is performing across multiple channels, all from inside Tekmatix.
Final Thoughts
Your ad data should not live in isolation.
When your advertising, leads, pipelines, sales and reporting are all connected, you can make much smarter decisions about where your money is going and what is actually producing results.
The new Google Ads dashboard widgets make it easier to see your performance, understand your spend and connect your campaigns to real business outcomes.
And that is exactly what good reporting should do.
Website / WordPress / Workflow
How to Track Google Ads Performance in Tekmatix Dashboards
Managing Google Ads is powerful, but let’s be honest, jumping between platforms just to check your ad performance can be a pain.
Now, you can view your Google Ads results directly inside your Tekmatix dashboards.
With the new Google Ads dashboard widgets, you can track your ad spend, clicks, impressions, conversions and campaign performance right where you already manage your business data.
No extra tabs. No separate reporting platform. No digging around trying to piece everything together.
Just clear, connected reporting inside Tekmatix.
What’s New?
A dedicated Google Ads section is now available inside the Tekmatix Dashboards widget panel.
Once your Google Ads account is connected at the sub-account level, your dashboard widgets will automatically pull in your Google Ads data.
You now have access to 11 ready-to-use Google Ads widgets, including:
Total conversions
Conversions over time
Total cost
Cost over time
Total clicks
Clicks over time
Total impressions
Impressions over time
Clicks by campaign
Conversions by campaign
CPC, also known as cost per click
Each widget is fully configurable, so you can filter your reporting by campaign, campaign type, zero impressions, zero conversions and PPC markup.
This means you can create the exact view you need, whether you’re checking your own ad performance or reporting results to clients.
Build Smarter Custom Metrics
Google Ads metrics are also now available as dimensions inside Custom Metrics.
This gives you the ability to build more meaningful cross-platform KPIs using the formula builder.
For example, you could create custom metrics such as:
Return on ad spend
Cost per closed deal
Cost per booked appointment
Cost per lead
Campaign spend compared with pipeline value
This is where your reporting becomes much more powerful.
Instead of only seeing how many clicks or conversions your ads generated, you can start connecting your advertising spend to real business outcomes.
How It Works
To add Google Ads widgets to your dashboard:
Open any dashboard inside Tekmatix.
Click Edit dashboard.
Click Add widget.
Scroll to the new Google Ads section.
Choose the widget you want to add.
Confirm your linked Google Ads account inside the Integration tab.
Configure your filters and chart type.
Click Save changes.
Once saved, your selected Google Ads widget will appear on your dashboard and display your reporting data automatically.
Why This Matters
See Everything in One Place
Your Google Ads performance can now sit alongside your other Tekmatix reporting widgets.
This means you can see your ad spend, clicks, impressions and conversions without logging into a separate advertising account every time you want an update.
For business owners, this saves time.
For agencies and service providers, this makes reporting much simpler.
Track Ad Spend at a Glance
With the Total Cost and Cost Over Time widgets, you can quickly see how much is being spent and when.
This makes it easier to monitor ad budgets, catch unusual spending patterns and avoid those lovely end-of-month surprises that nobody asked for.
See Which Campaigns Are Actually Working
The Clicks by Campaign and Conversions by Campaign widgets let you break down performance at the campaign level.
This helps you quickly identify which campaigns are generating activity and which ones may need attention.
Because clicks are nice, but conversions are what usually matter most.
Connect Advertising to Real Business Results
This is the big one.
Because Google Ads data can now be used inside Custom Metrics, you can combine ad performance with your pipeline, sales and revenue data.
That means you can move beyond surface-level reporting and start answering much better questions, such as:
How much did we spend to generate this lead?
Which campaigns are turning into booked appointments?
What is our cost per sale?
Are our ads generating real return?
Which campaigns should we scale, pause or improve?
This helps turn your dashboard into a proper decision-making tool, not just a collection of pretty charts.
Important Notes
Google Ads must be connected at the sub-account level before the widgets can show data.
To connect your account, go to:
Settings → Integrations → Google Ads
All 11 widgets support filtering by:
Campaign
Campaign type
Zero impressions
Zero conversions
PPC markup
These Google Ads reporting features are available inside:
Dashboards
Reporting
Custom Metrics
They are available on all Tekmatix plans that include Dashboards and Reporting.
What’s Coming Next?
More cross-channel reporting is on the roadmap, including the ability to combine Google Ads data with other marketing sources.
This means you’ll be able to get an even clearer view of how your marketing is performing across multiple channels, all from inside Tekmatix.
Final Thoughts
Your ad data should not live in isolation.
When your advertising, leads, pipelines, sales and reporting are all connected, you can make much smarter decisions about where your money is going and what is actually producing results.
The new Google Ads dashboard widgets make it easier to see your performance, understand your spend and connect your campaigns to real business outcomes.
And that is exactly what good reporting should do.
Copyright © 2022 TekMatix. All rights reserved | [email protected]